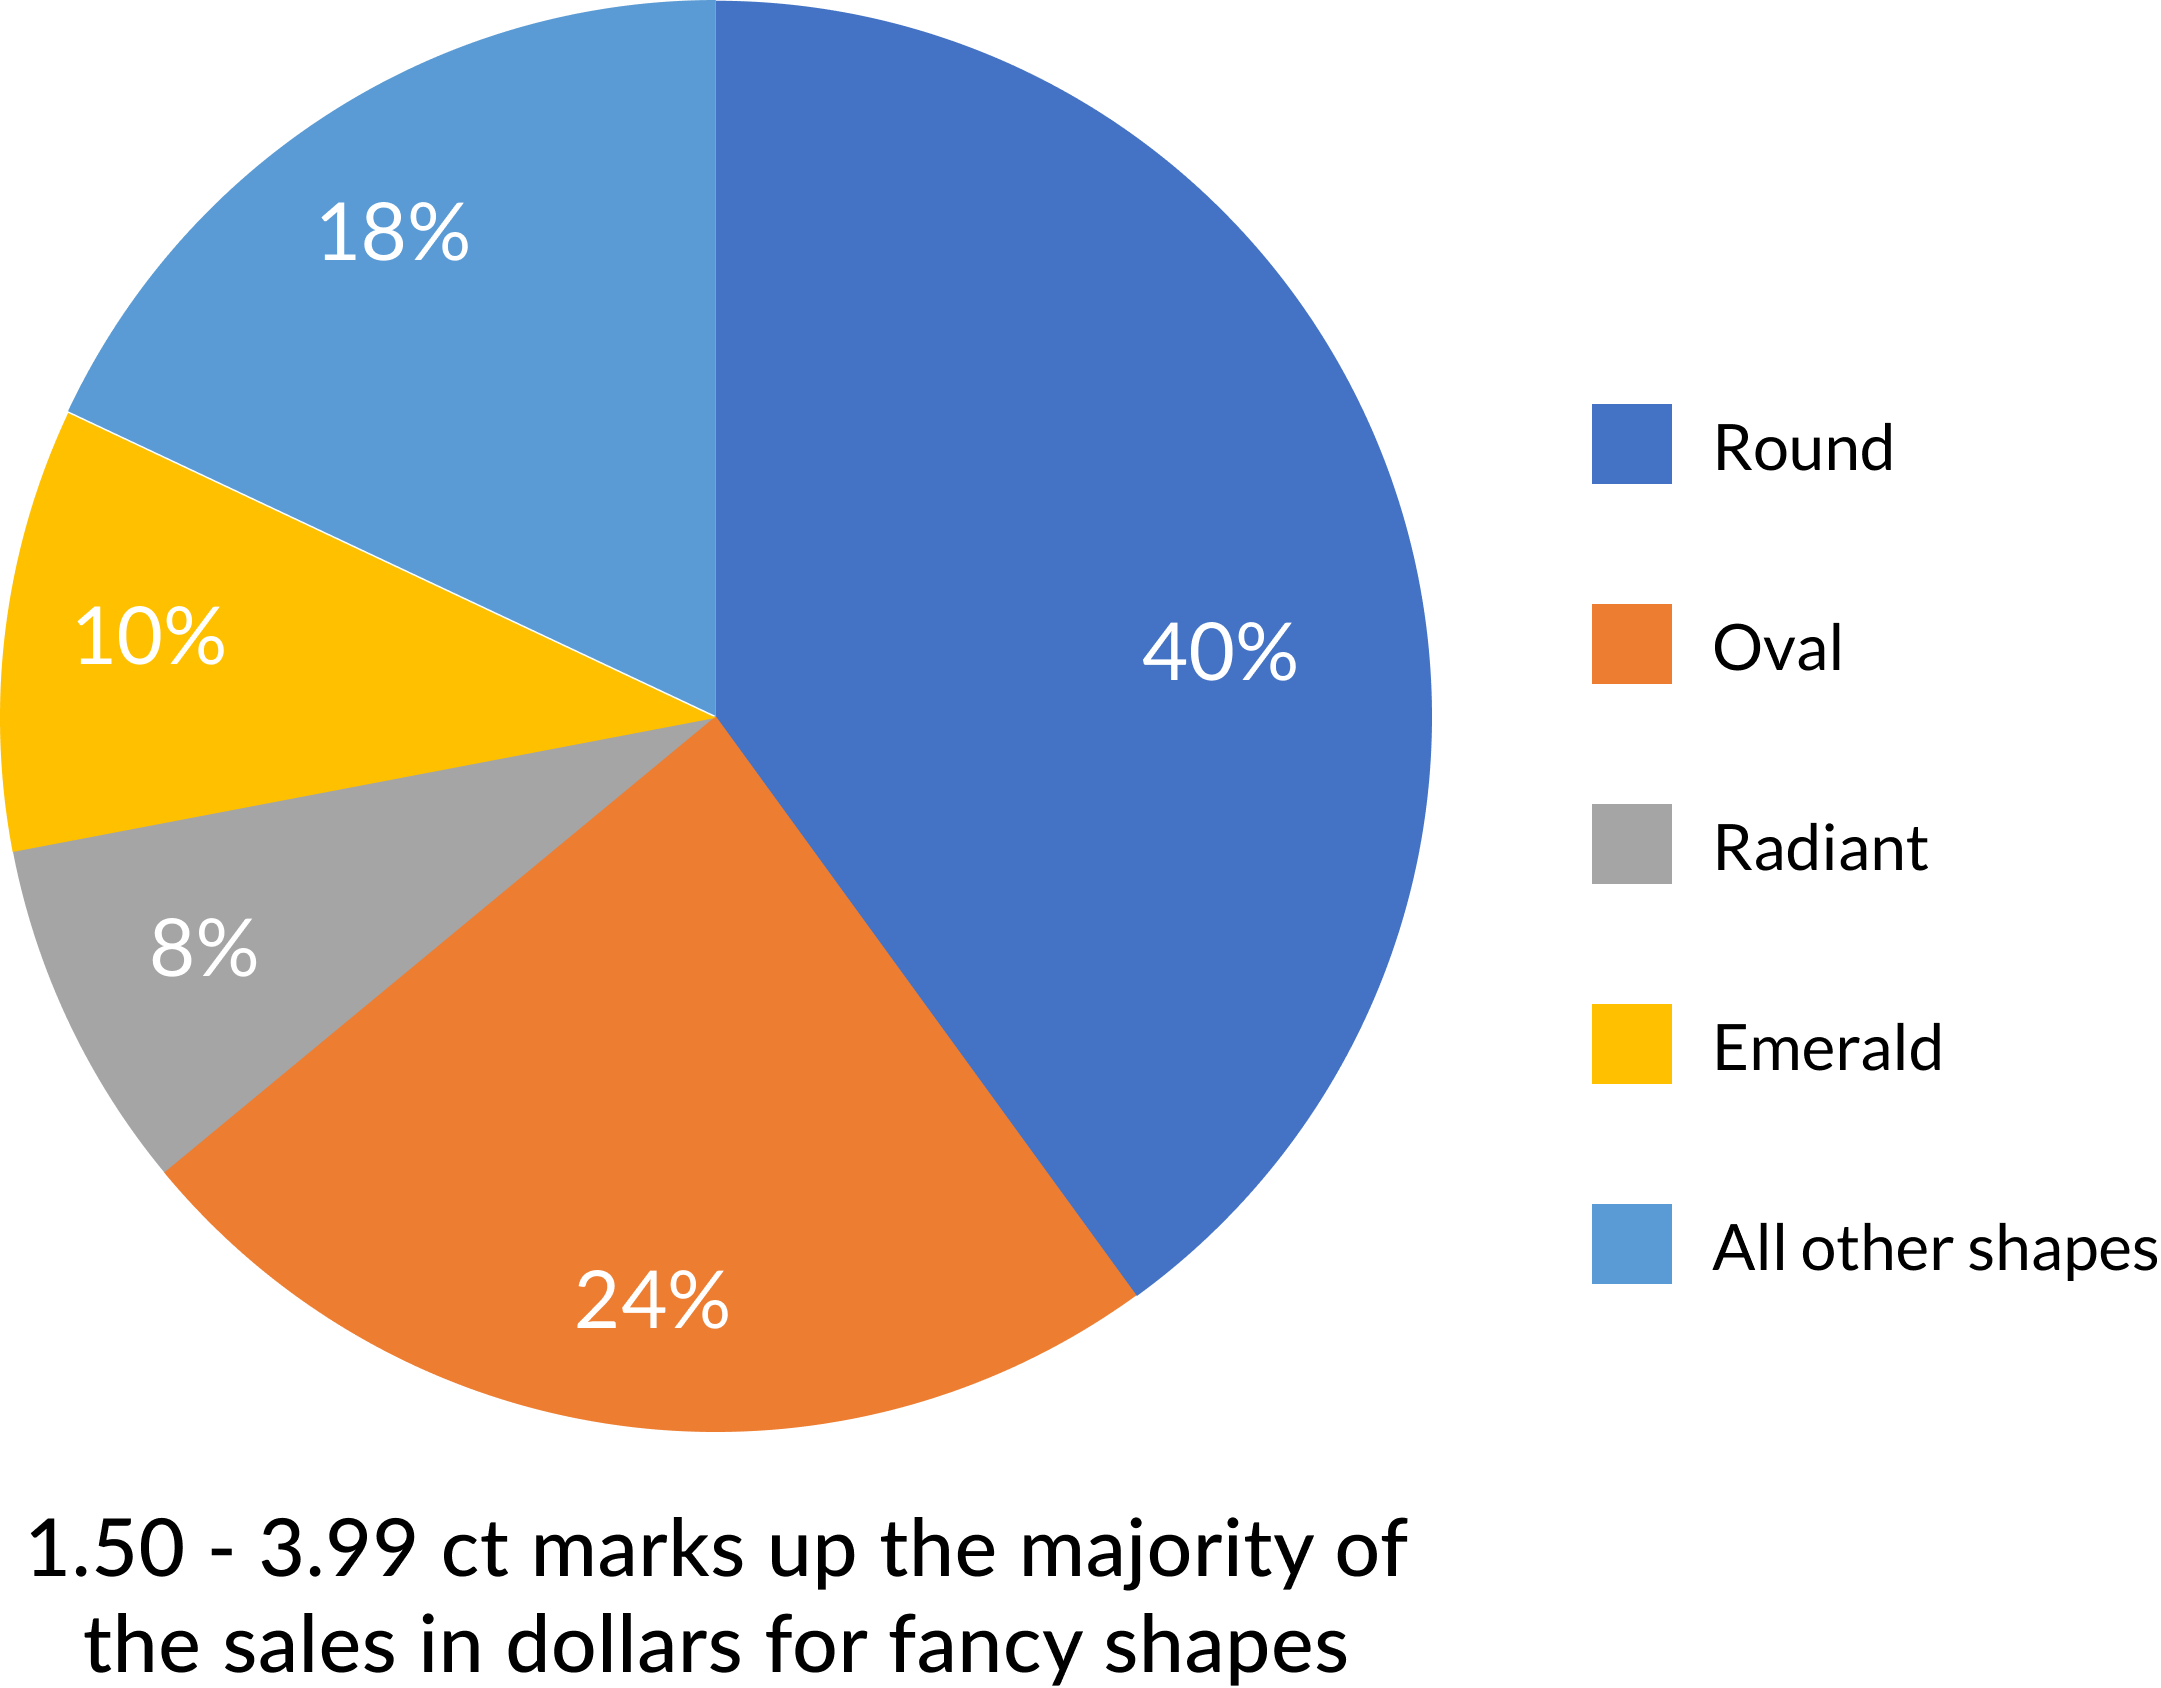
Diamond sales by shape
This graph shows the distribution of sales by shape, with round diamonds leading, followed by ovals and others.
| SHAPE | % of sales |
|---|---|
| Round | 40 |
| Oval | 24.3 |
| Radiant | 8 |
| Emerald | 10 |
| All other shapes | 17.7 |
This graph shows the distribution of sales by shape, with round diamonds leading, followed by ovals and others.
| SHAPE | % of sales |
|---|---|
| Round | 40 |
| Oval | 24.3 |
| Radiant | 8 |
| Emerald | 10 |
| All other shapes | 17.7 |
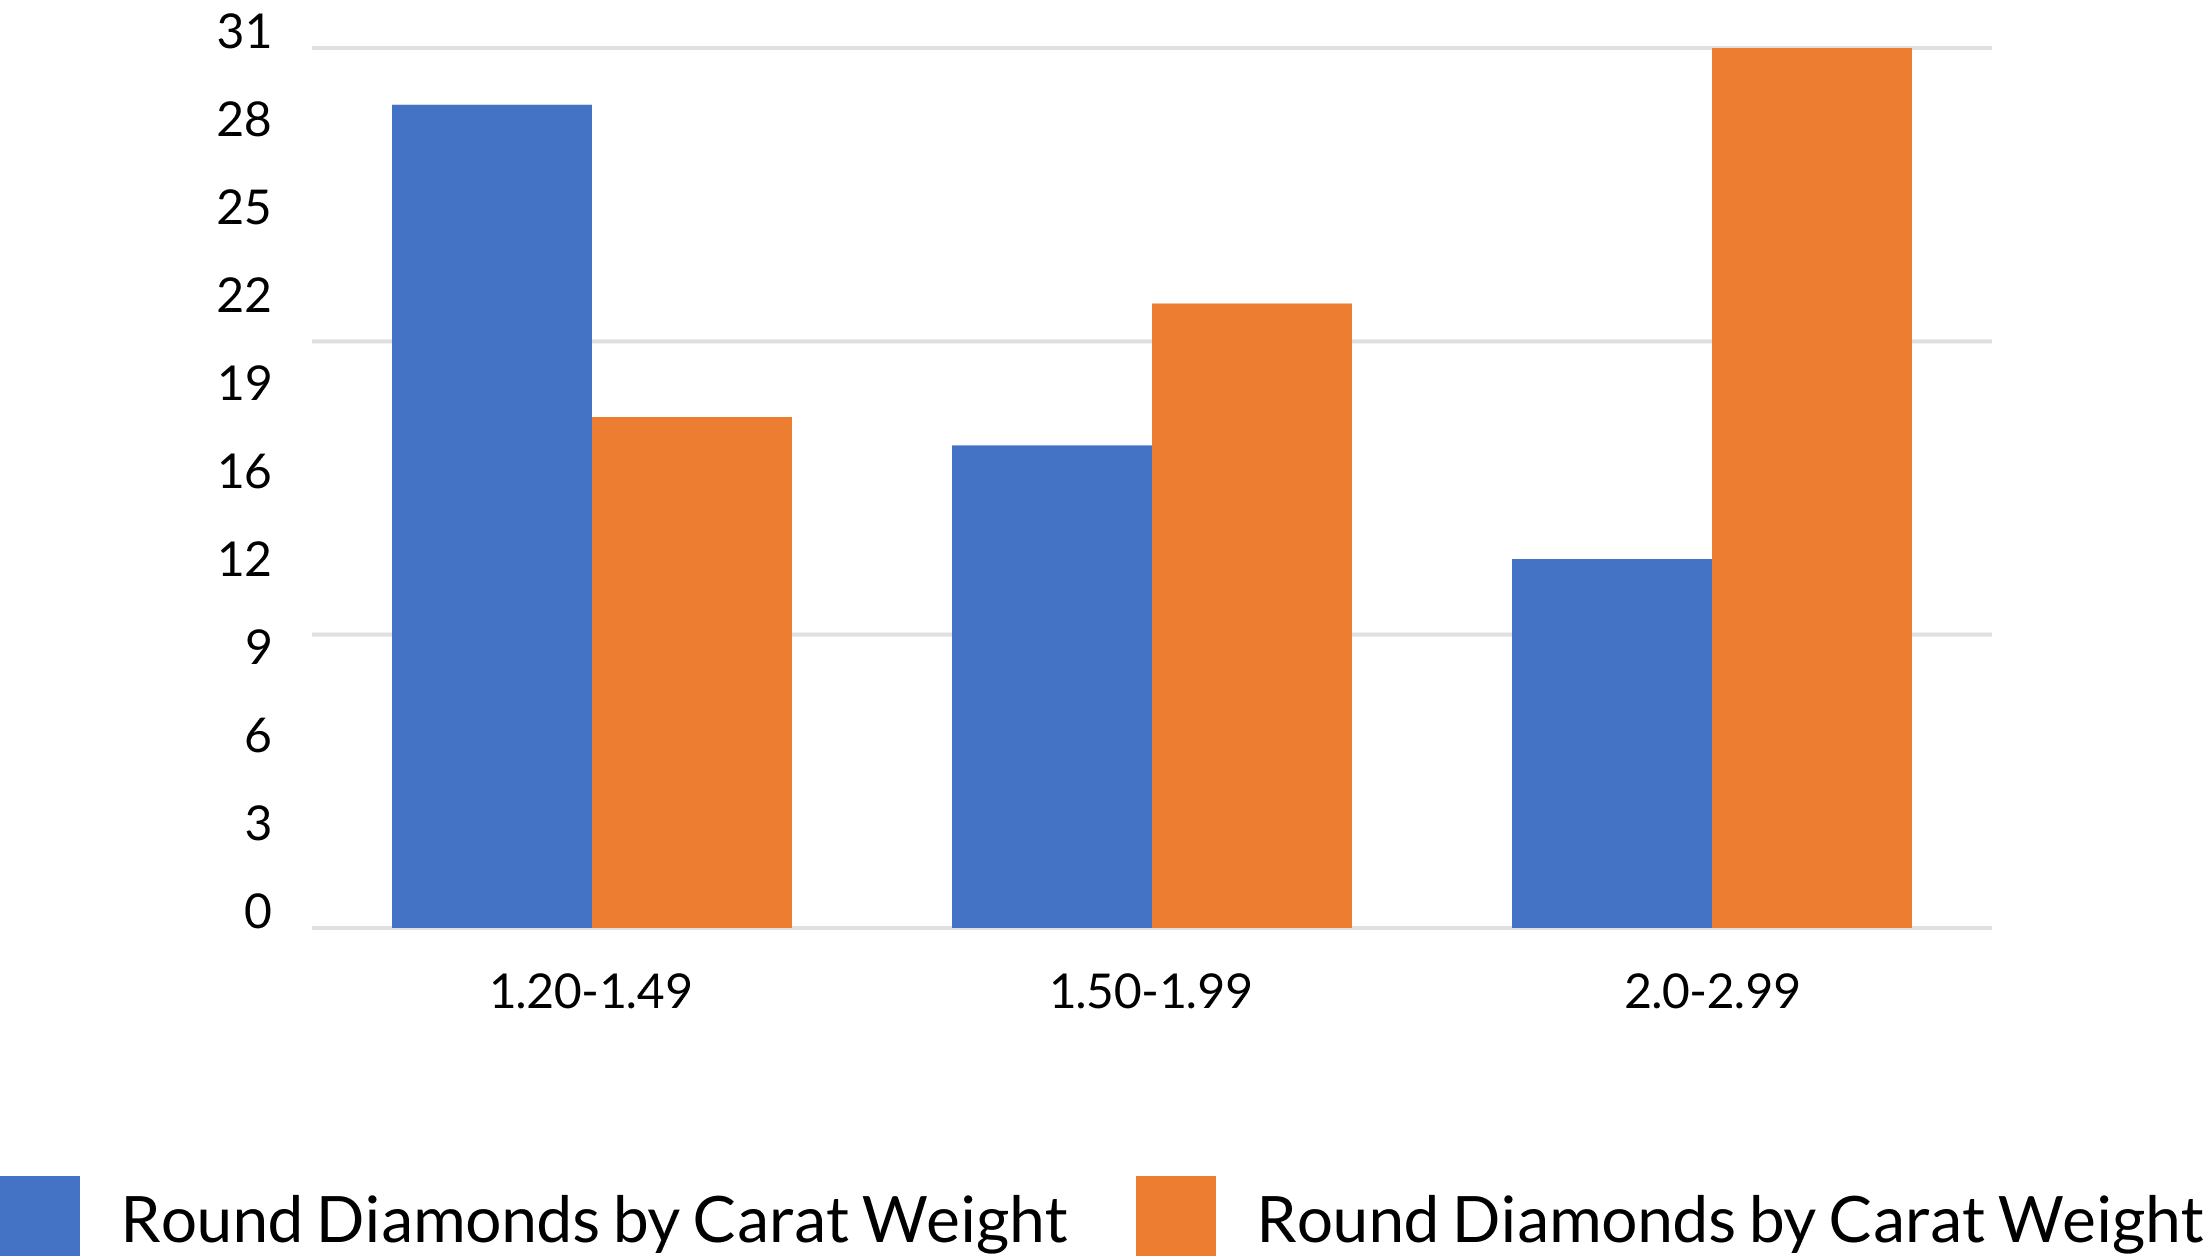
This graph shows unit and revenue percentages by carat size, highlighting consumer preferences across sizes.
| carat |
% of sales (by unit) |
% of revenue (by dollars) |
|---|---|---|
| 1.20-1.49 | 29 | 18 |
| 1.50-1.99 | 17 | 22 |
| 2.0-2.99 | 13 | 31 |
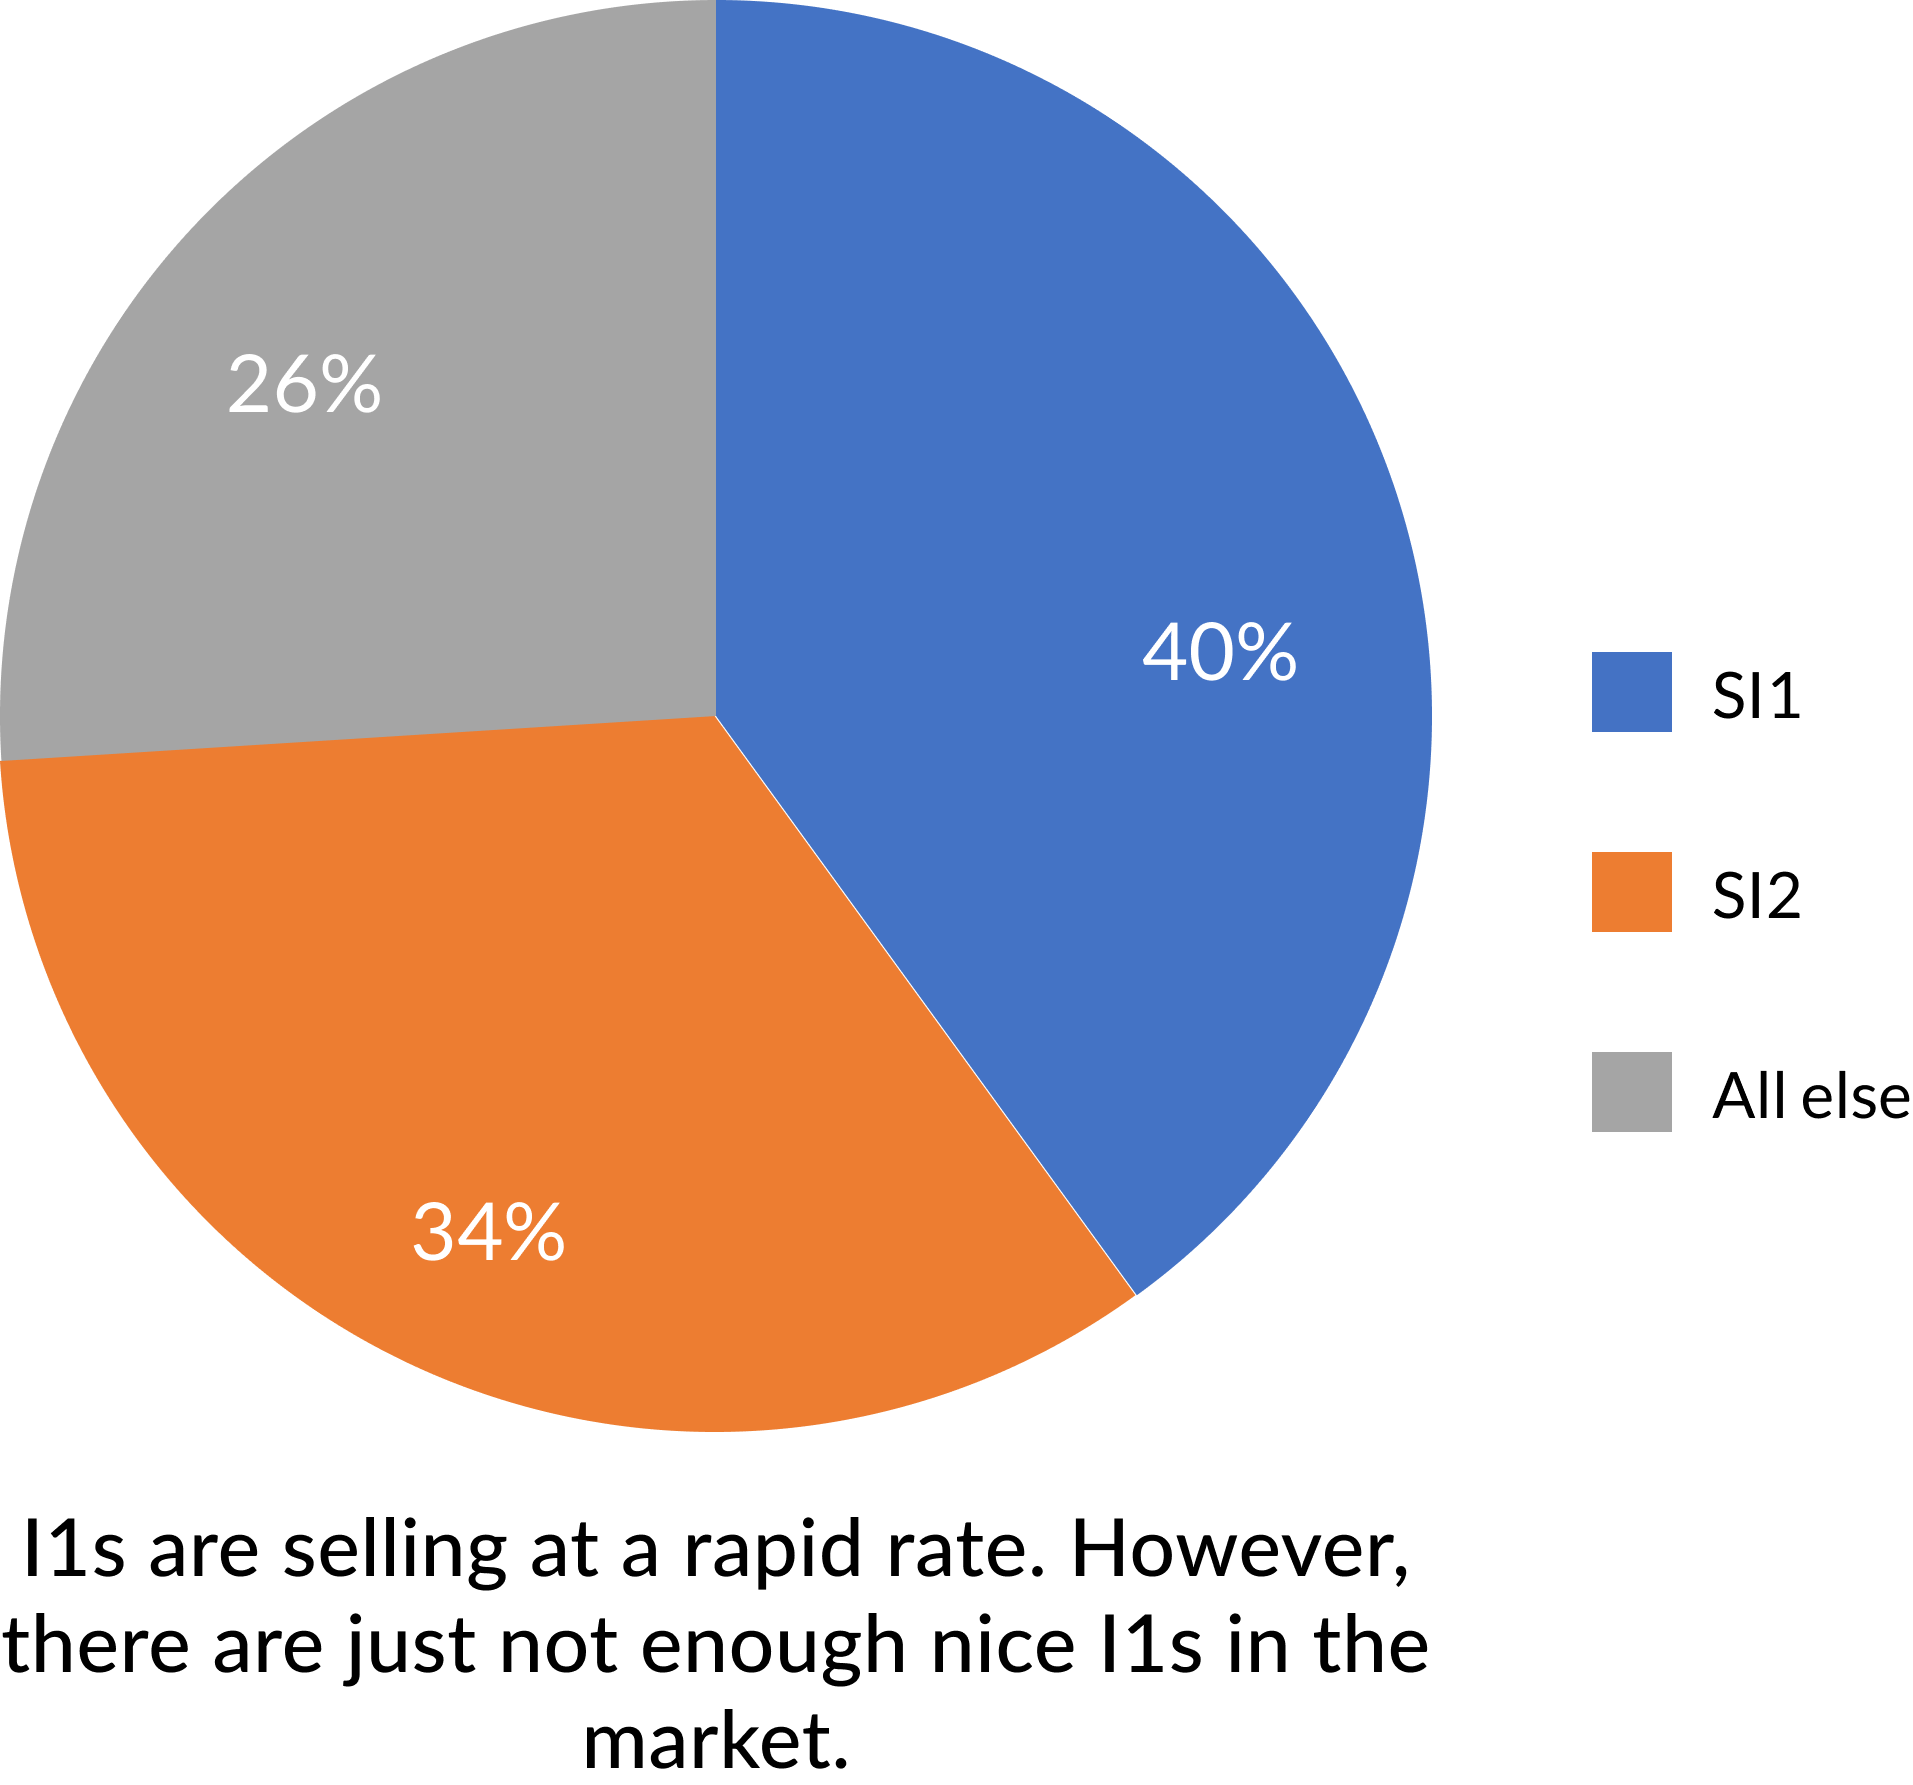
This graph shows sales by clarity grade, highlighting consumer preferences and market trends.
| Clarity | % of sales |
|---|---|
| SI1 | 40 |
| SI2 | 34 |
| All else | 26 |
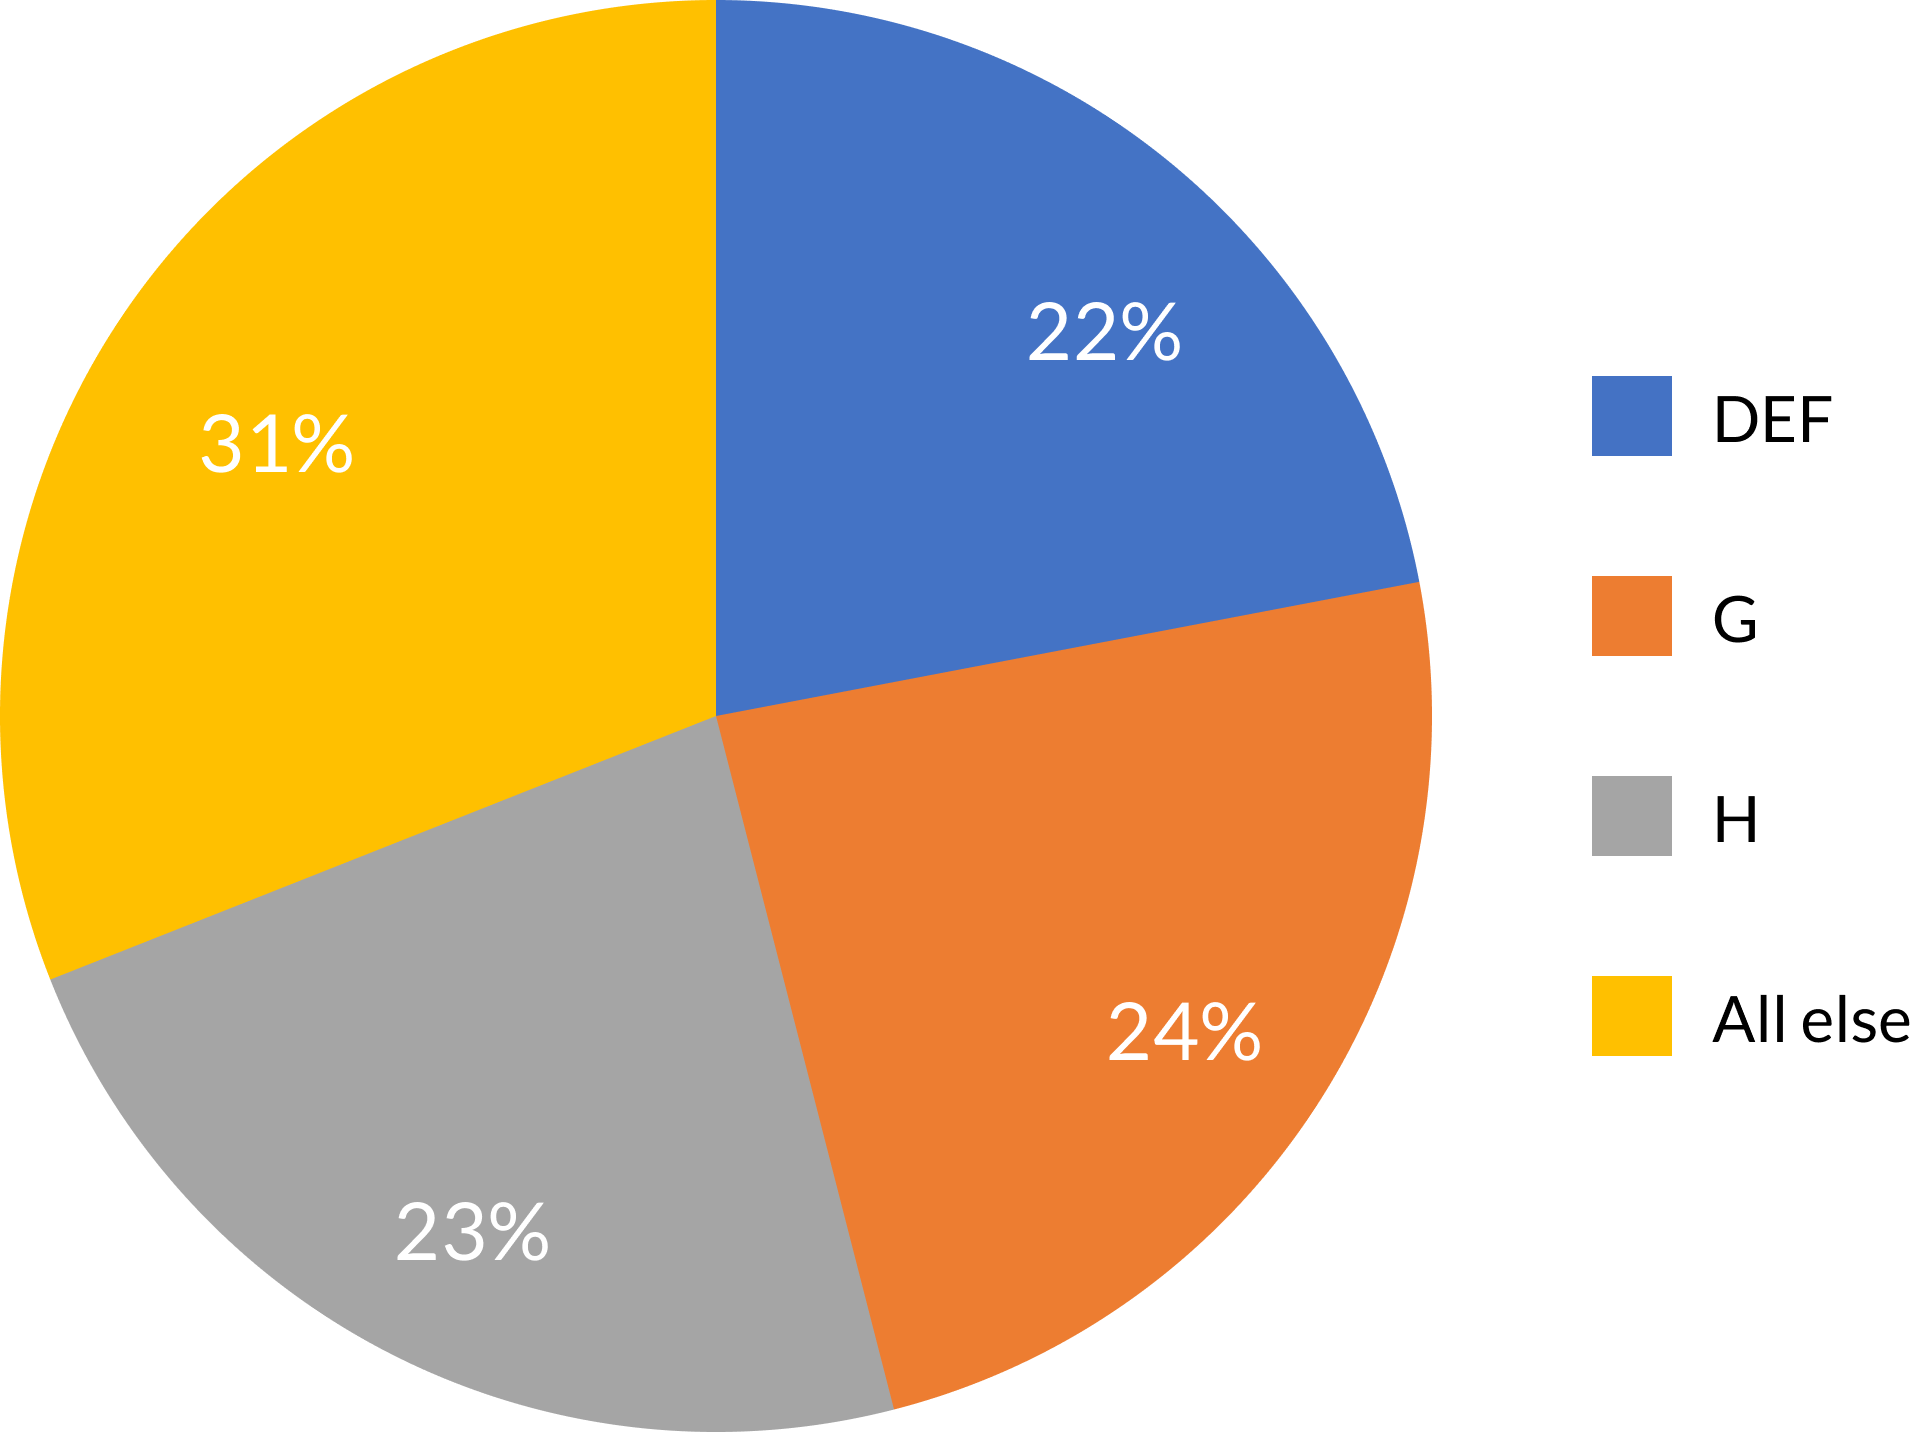
This graph shows sales by color grade, highlighting consumer preferences and market trends.
| color | % of sales |
|---|---|
| DEF | 22 |
| G | 24.4 |
| H | 22.9 |
| All else | 30.7 |
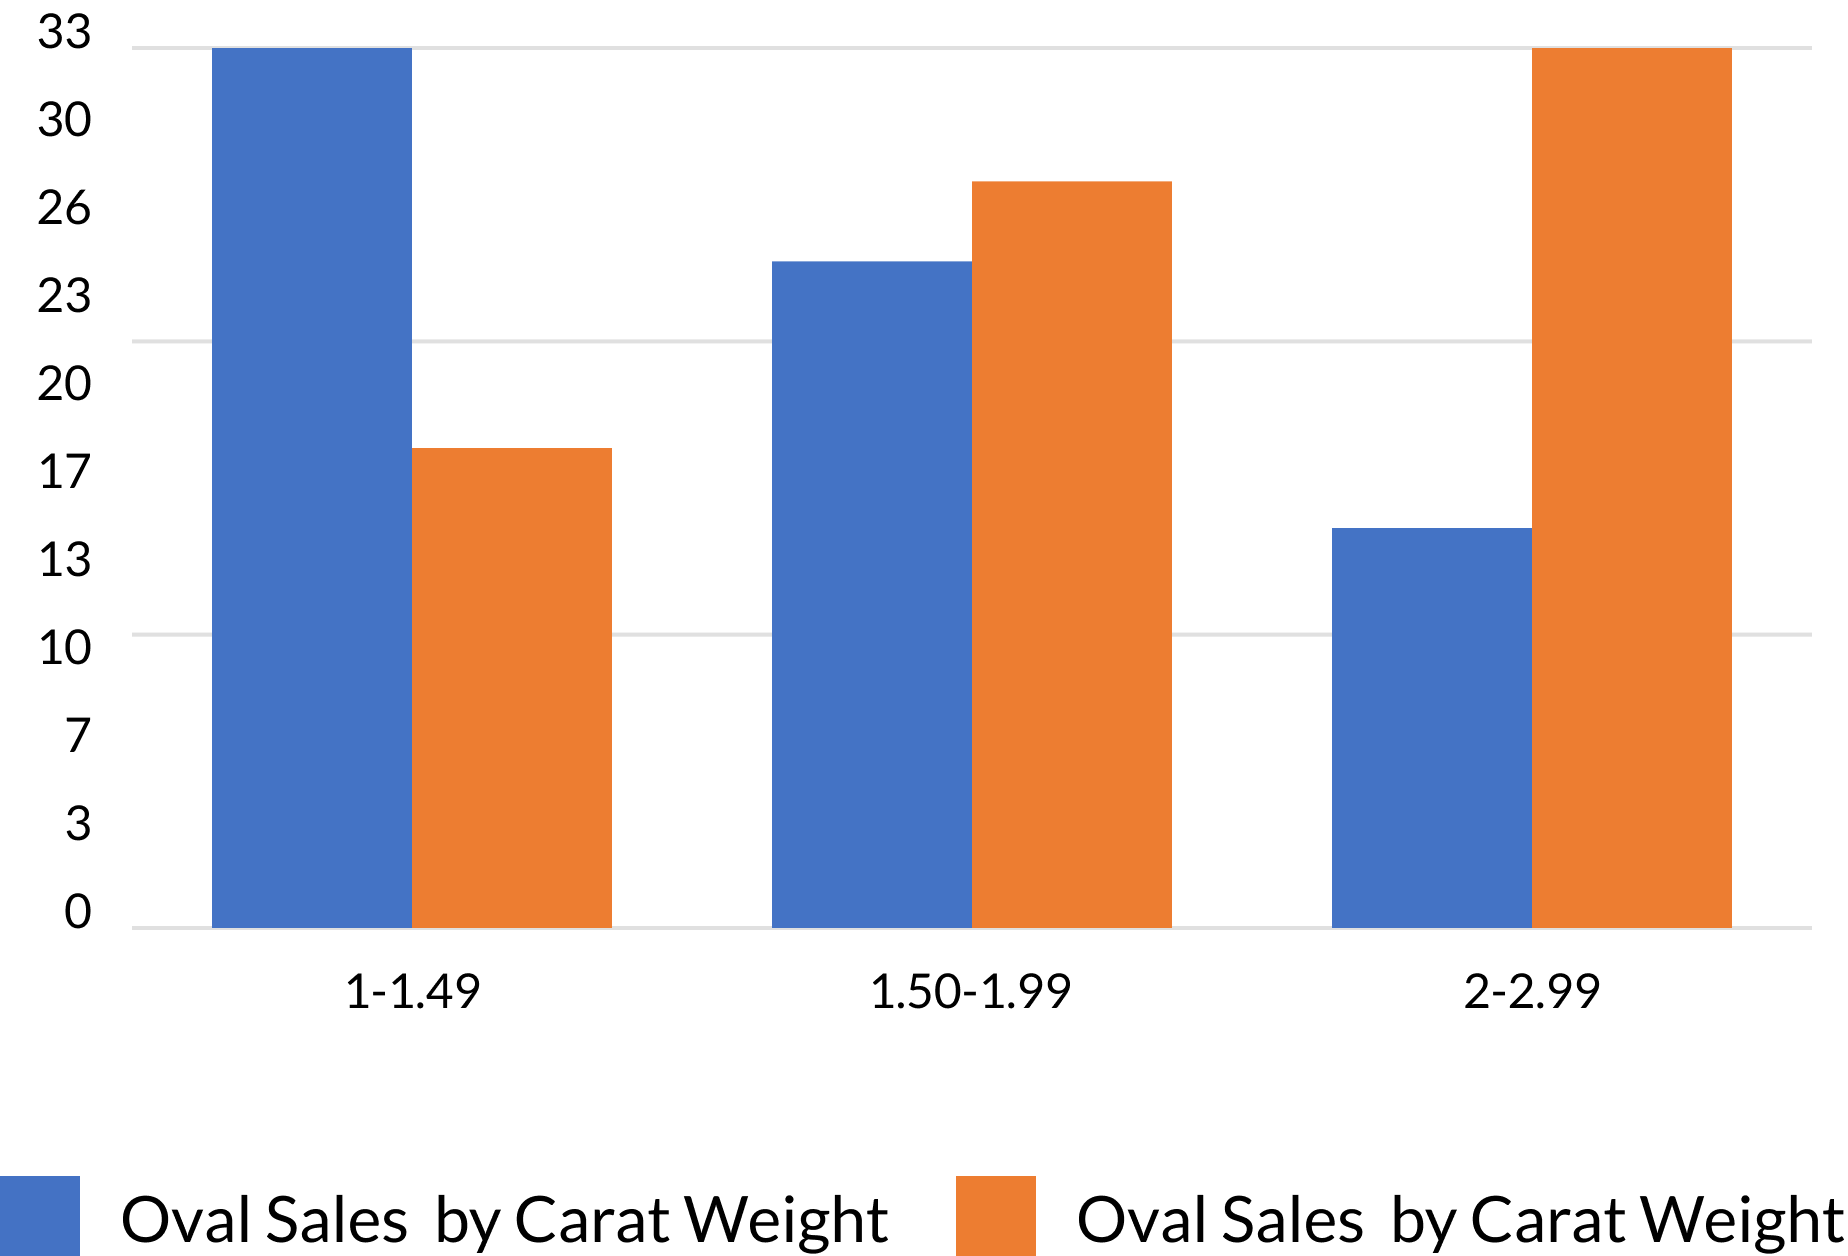
This graph shows oval diamond sales by carat size, highlighting trends in unit sales and revenue.
| carat |
% of sales (by unit) |
% of revenue (by dollars) |
|---|---|---|
| 1-1.49 | 33 | 18 |
| 1.50-1.99 | 25 | 28 |
| 2-2.99 | 15 | 33 |
This graph shows sales by clarity grade, highlighting consumer demand and each grade’s share of units and revenue.
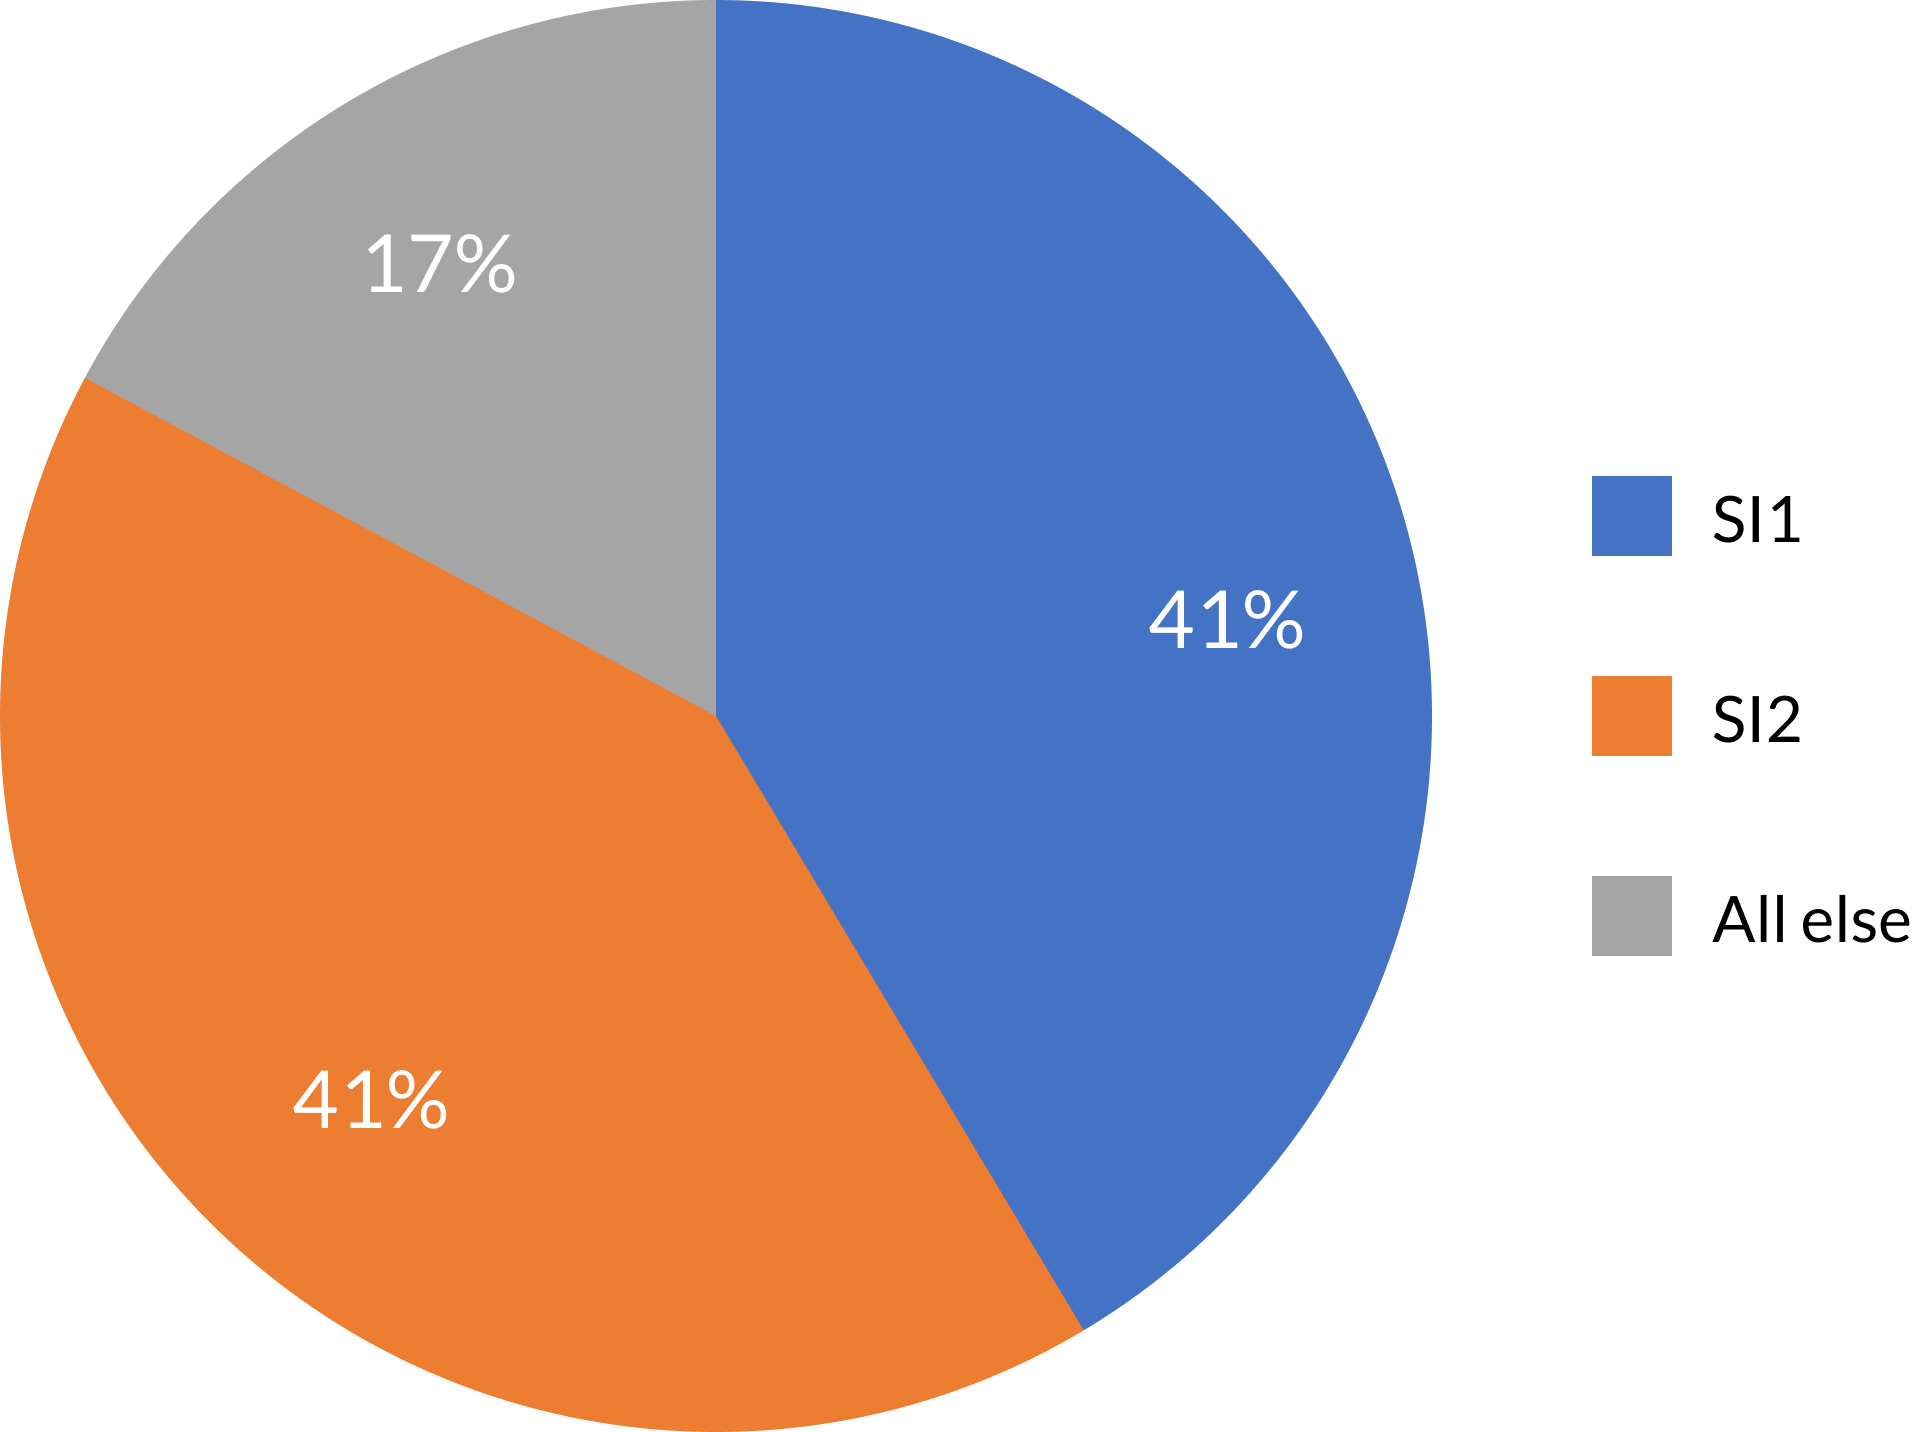
| Clarity | % of sales |
|---|---|
| SI1 | 41.4 |
| SI2 | 41.3 |
| All else | 17.3 |
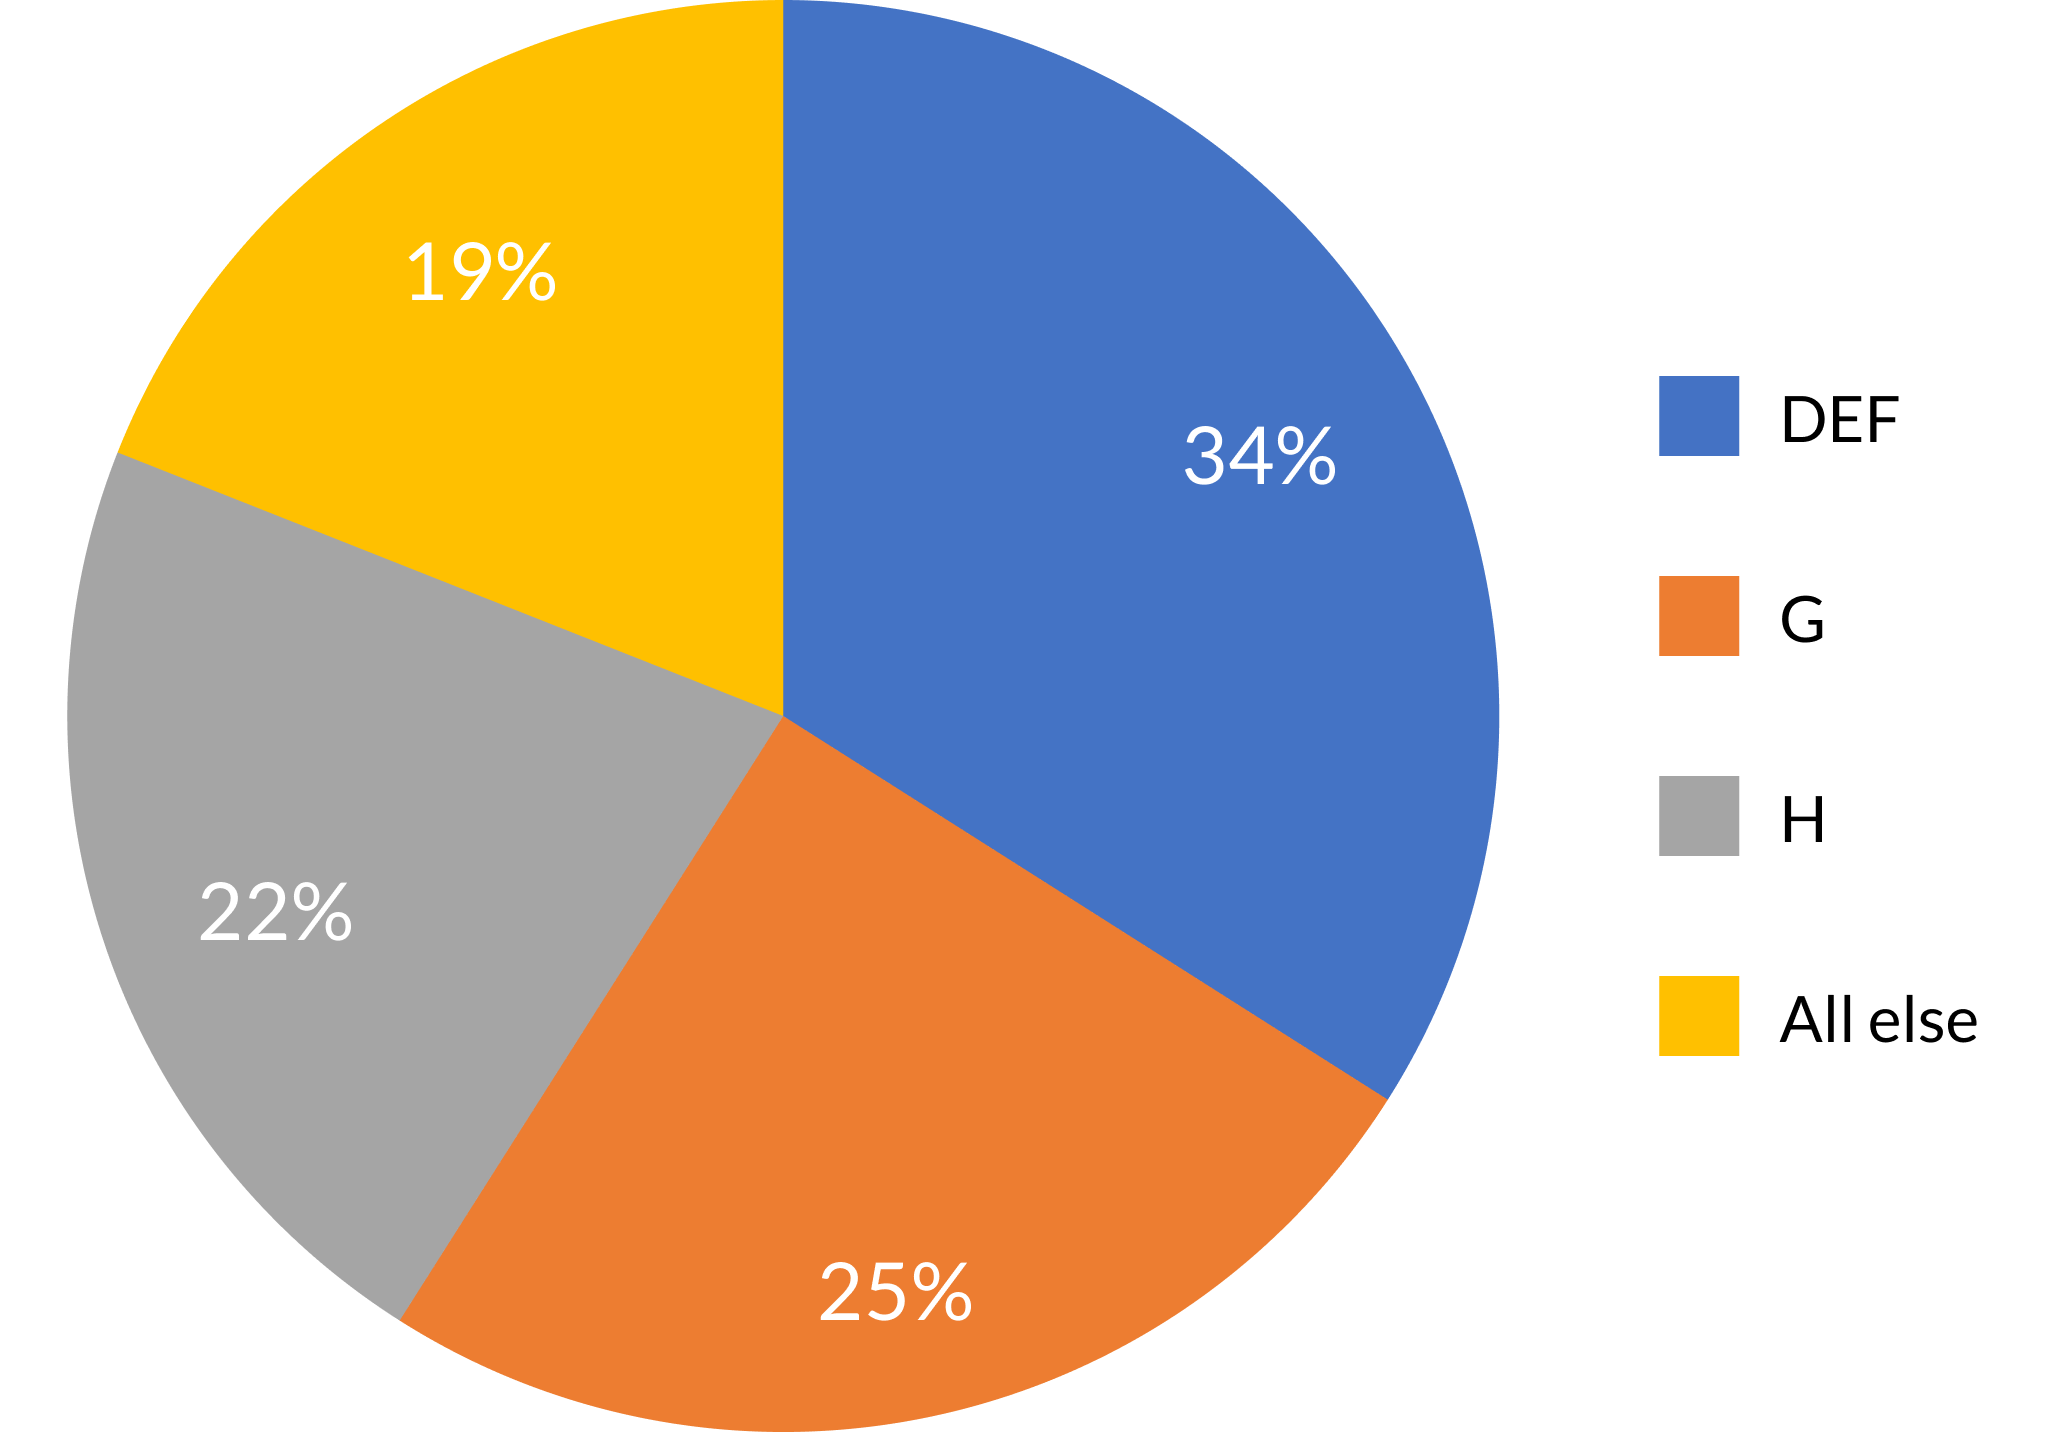
This graph shows sales by color grade, highlighting consumer preferences and each grade’s share of units and revenue.
| color | % of sales |
|---|---|
| DEF | 34 |
| G | 24.6 |
| H | 22.3 |
| All else | 19.1 |
of your area to maximize inventory and turn profitability.
Call us today at 1-800-724-8810
Call now